When business teams say they want a dashboard, they are usually expressing a need for visibility. They want faster answers, fewer spreadsheets, less manual exporting, and a clearer view of what is happening. The problem is that dashboards and reporting systems solve different parts of that problem.
If you treat them as the same thing, you often end up with a tool that looks polished but does not actually support the workflow the business depends on.
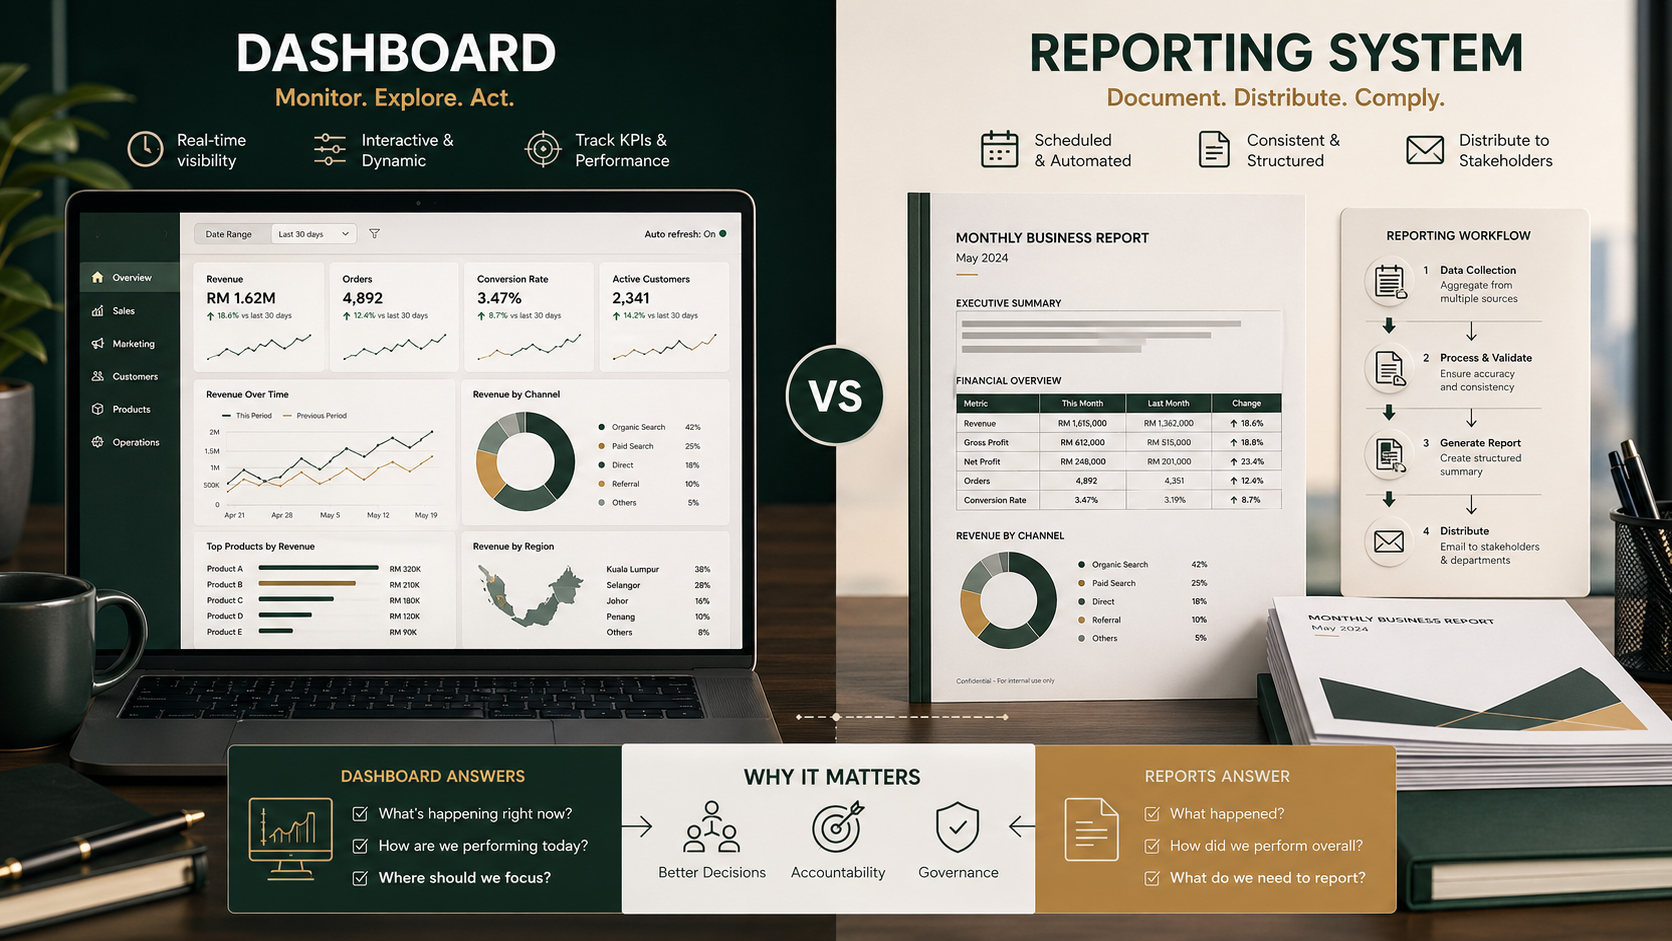
A dashboard is usually best for quick visibility and interaction. A reporting system is usually best for consistent, repeatable, distributed outputs that people depend on operationally.
What a dashboard is for
Oracle describes operational dashboards as tools that provide greater visibility into business processes and let users visualize data interactively with charts and filters. IBM frames dashboards as a fast way to visualize data, explore patterns, and identify insights without heavy report-building.
That is a useful practical definition. A dashboard is meant to help people see what is happening quickly. It is usually screen-based, interactive, and designed for monitoring. It may show KPIs, trends, exceptions, or segment performance in one place.
A good dashboard helps someone ask questions like:
- What changed today?
- Which branch is underperforming?
- Where is the drop-off happening?
- Which campaign is generating the strongest result?
What a reporting system is for
A reporting system is less about exploration and more about reliable delivery. IBM describes reports as better for detailed, consistent, continuous deliverables, especially where scheduling, filtering, distribution, and structured output matter.
In practical business terms, a reporting system is what you build when the organisation needs data to be delivered in a repeatable format to the right people at the right time. That may include PDF reports, scheduled email delivery, role-based views, branch-level summaries, finance packs, operational listings, or exportable datasets.
A reporting system helps someone answer questions like:
- What should management receive every Monday morning?
- What report does each branch manager need every day?
- What filtered output should finance, operations, and leadership each receive?
- What data must be archived, exported, or distributed regularly?
Why businesses confuse the two
The confusion usually happens because the user-facing layer looks similar. Both dashboards and reports can contain charts, tables, filters, and business metrics. But the real difference is not visual. It is functional.
Businesses often ask for a dashboard because that word feels modern and easy to understand. But once you unpack the need, what they really want may be one of these:
- Automated weekly distribution to different stakeholders
- Branch-by-branch reporting with role-based filtering
- Exportable operational detail, not just top-line KPIs
- A documented recurring report for management review
- A governed reporting layer that people can rely on consistently
Those needs point more strongly toward a reporting system than a dashboard alone.
When you need a dashboard
You probably need a dashboard when the business wants fast visibility and active monitoring. Good use cases include:
- Sales performance monitoring throughout the day
- Campaign or channel tracking in near real time
- Operations managers checking stock, fulfilment, or branch activity
- Leadership needing an at-a-glance view of business health
The key trait here is interactivity. Dashboards work well when users need to filter, scan, compare, and drill into current or recent performance.
When you need a reporting system
You probably need a reporting system when the business depends on regular outputs, consistent formatting, and reliable distribution. Common use cases include:
- Daily branch reports sent to managers automatically
- Weekly finance and operations packs
- Scheduled KPI reports by department or user role
- Audit-friendly outputs with a fixed structure
- Recurring PDF, CSV, or email-based reporting workflows
This is where many businesses get stuck. They ask for a dashboard, but what they actually need is a reporting engine behind the scenes.
Why the distinction matters before you build
If you ask for the wrong thing, the solution is usually built around the wrong architecture. A dashboard-first approach may create beautiful screens, but still fail if the business really needs automated distribution, detailed drill-down listings, or role-based recurring outputs.
On the other hand, a reporting-first build can feel too rigid if the real need is operational visibility and live exploration.
This distinction matters commercially too. A dashboard project and a reporting system project often have different scope drivers:
-
1Data model design. Dashboards may prioritise summary metrics, while reporting systems often need detailed and governed data slices.
-
2User roles. Reporting systems often need different outputs for different recipients, while dashboards may serve a smaller set of active users.
-
3Distribution logic. Scheduled delivery, subscriptions, exports, or report bursting are reporting-system requirements, not just visual design tasks.
-
4Operational dependency. If people rely on the output to run the business every day, the reporting layer has to be designed more carefully.
What Malaysian businesses often need in reality
In many Malaysian businesses, especially SMEs and multi-branch operators, the right answer is not dashboard or reporting system. It is dashboard plus reporting system.
Management may need a live dashboard for visibility, while finance or operations need scheduled daily and weekly outputs. A branch manager may want a fast screen view, while HQ needs a standardised PDF or export pack. Treating all of that as a single dashboard requirement usually produces a messy compromise.
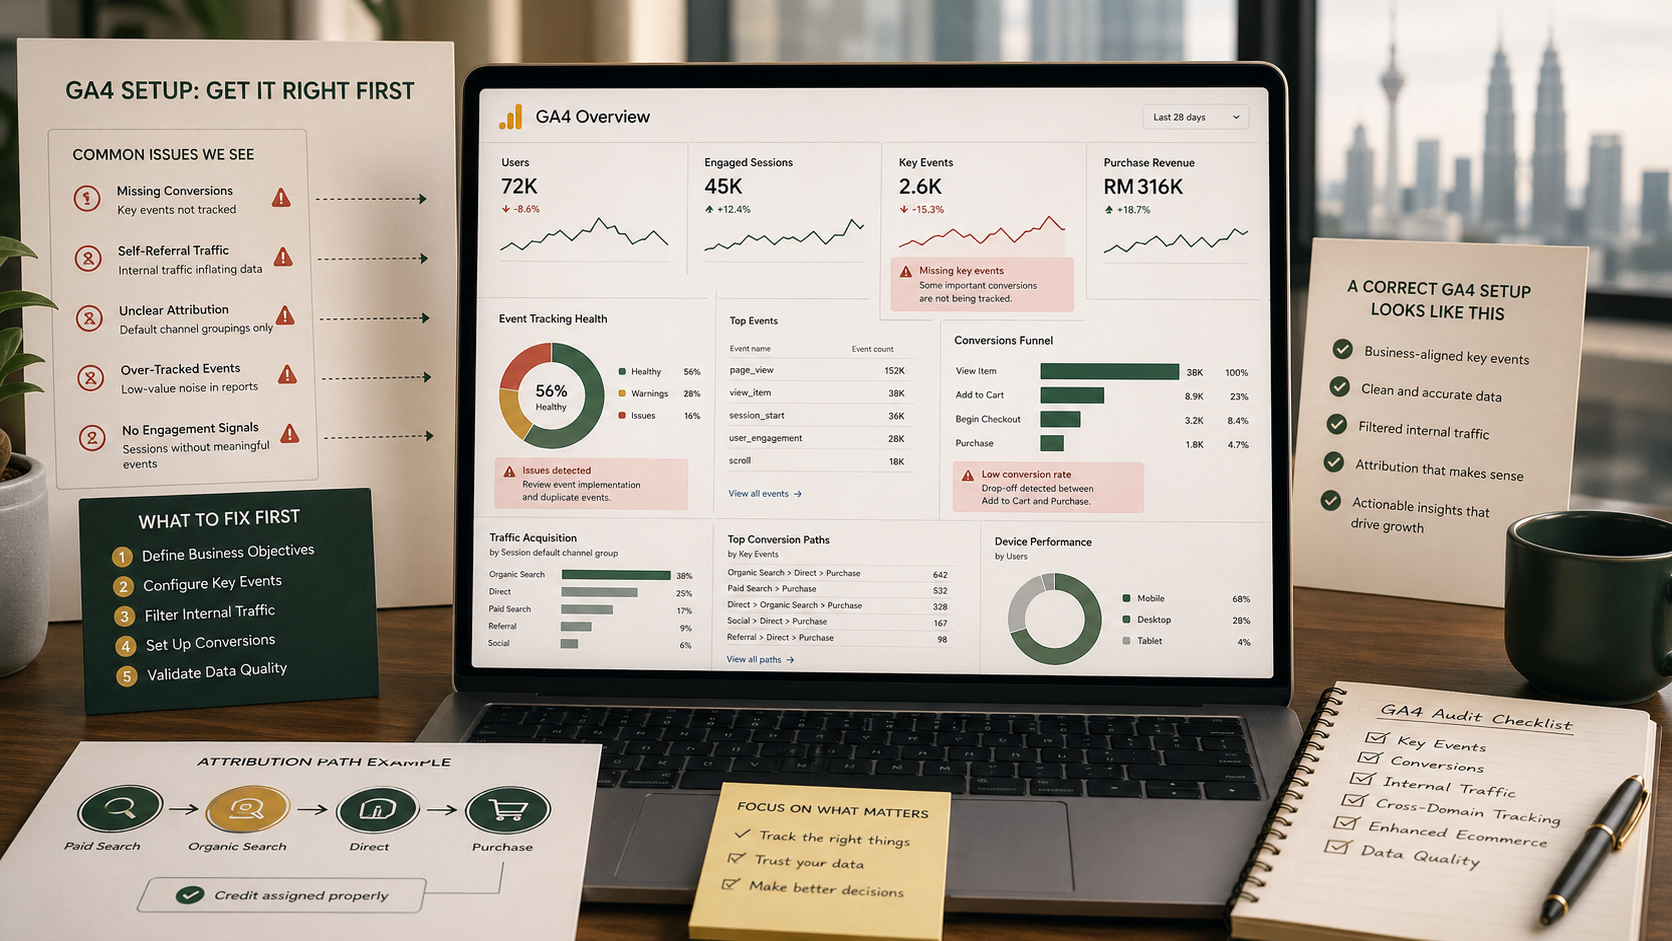
This becomes even more important when teams are trying to connect multiple data sources or improve analytics quality. If your measurement layer is weak, the dashboard will be weak too. That overlap often shows up in our article on why businesses use GA4 wrong.
A simple way to decide
If you are not sure which one you need, ask these questions first:
- Do users need to monitor performance interactively, or receive structured outputs automatically?
- Is the main need visibility, or scheduled delivery?
- Will different people need different filtered versions of the same output?
- Is the system mainly for exploration, or for repeatable business process reporting?
If the answer leans toward exploration and monitoring, start with a dashboard. If it leans toward consistency, distribution, and routine operational use, you need a reporting system. If both matter, design for both from the start.
This article provides general information only and should not be treated as legal, technical, or procurement advice. The right reporting structure depends on the business process, data maturity, user roles, and operational reliance involved.